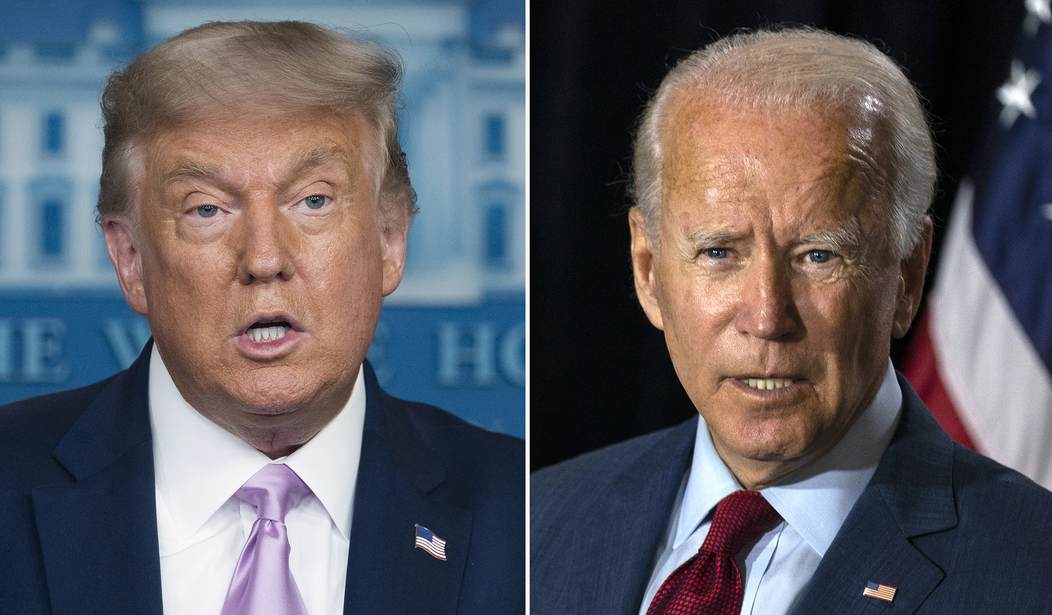
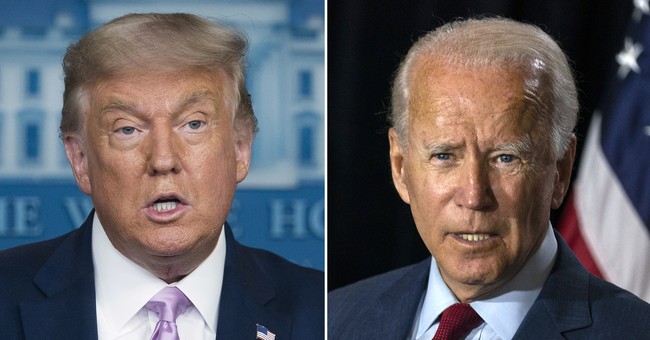
On September 1, 2020, The Economist/YouGov released a National Presidential “Poll” [Quotes Added] in which they declare Joe Biden has a monstrous 11 point lead on Donald Trump. As a polling nerd, I decided to take a deeper look at it.
In order to analyze the data, we must first identify what we are looking at here. First, is what polling firms call “topline” or the data that is presented to you as the consumer. The topline data is the direct answers to the questions for the poll. We ask 100 people, for “who are they voting?” 52% say Bob, and 48% say, Steve. That is topline data.
Further down in most polls, you find cross-tab and methodology information. It shows how people, with certain demographic and other identifying information, respond to certain questions within that poll. If the questions for 100 people is, “for whom are they voting?”, topline data will say that 52 – 48 with Bob in the lead, but cross-tabs, or applying a filter of how people who answered a question one way answered another question, will tell us that 88% of Democrats are voting for Steve, and 95% of Republicans are voting for Bob, as applied to the topline number.
Primarily, when I look at polls, topline means very little to me in the long-run. I want to see the methodology (how the people who participated were chosen) and the cross tabs (how those people voted and if possible, why).
When reviewing polls in 2016, I came across bad poll after bad poll as a result of oversampling problems as well as push-poll lines of questions or questions that are framed in a way to influence the way someone answers. For instance, if a polling firm asked a question “Do you agree with Joe Biden’s call for all Americans to unite?”, it doesn’t leave any room for someone saying they disagree with the premise of the question, that is, Joe Biden even having that ability in the first place. Another example of a push poll question is “Do you support Donald Trump’s divisive rhetoric?” Maybe the respondent doesn’t believe Trump’s rhetoric is divisive. Maybe the respondent thinks the Democrats’ rhetoric is divisive. Either way, a respondent is less likely to respond in the affirmative to supporting divisive rhetoric and therefore would lead to a skewing of the results.
Polls should also not be opt-in. I will only say this once: ANY OPT-IN POLL WILL DELIVER AN FLAWED RESULT. Opt-in polling allows for people to seek out a poll or even be paid to participate in the poll. The moment a poll removes the random and unbiased nature of the results, those results are invalid, full stop.
Polling should ALWAYS be only of Registered Voters. Asking a non-registered voter or an ineligible voter their opinion on a voting issue is the equivalent of asking the Queen of England who is she is voting for in the US Presidential election. In other words, including “US Adults” in a poll should never (and I repeat NEVER) be considered an accurate poll. Questions asking respondents whether or not they are registered are worthless as they are self-reported and could be completely wrong, yet polling will reflect their answer as if they are registered to vote.
Allowing for voters to self-report voter frequency is another poll-faux pas that polling firms commit left and right. As stated above, most voters over-state their voting behavior when questioned. If they are only a causal voter, most respondents will not admit to being so as that would suggest they are not as well-versed as other, more frequent voters. The voters contacted by polling firms should ALWAYS be chosen for contact based upon their propensity.
Another trait of a good poll is one that has correct sampling. If a subsection of a population we are attempting to poll is 40% Republican, 40% Democrat, and 20% Independent/DTS/NPP, then you will either want to make sure your poll reflects that sampling or is weighted for that sample. If my sample for my poll ends up being 50% Republican, 25% Democrat, and 25% Independent/DTS/NPP, then I have incorrectly polled the population and my results will almost definitely incorrectly favor Republicans.
As voter data is public, the ability of polling firms to correctly acquire a sample for a poll should be pretty easy. Without a doubt, polling firms could determine someone’s registration status AND propensity BEFORE they are even contacted. In 30 states where party preference is available as well, polling firms could contact those they need to to achieve an accurate sample. In the 20 states that you cannot obtain voter party preference from the public data, allowing for respondent-defined voter preference is acceptable.
The problem with the vast majority of polls is that they make some pretty horrible mistakes when it comes to the above-mentioned traits of a good poll.
Let’s examine the Economist / YouGov poll published on September 1, 2020. (<— follow the link if you’d like to follow along)
First, as a matter of attempting to compliment the “poll,” the organization they present here is fantastic. My ability to navigate the poll from the first five pages is excellent. I wish more polling firms would release their data like this, linking questions to the results and allowing people to navigate the poll with a few clicks. While that doesn’t have anything to do with how the results were reached, bravo to them for doing this part.
Unfortunately, that’s where my compliments end. The vast majority of the rest of this poll is a disaster. To start, there was a minimum of 130 questions in this poll (minimum because there were identifying questions asked for cross-tabbing). Talk about respondent fatigue. Respondent fatigue occurs when people get tired of the length of a poll and start firing off answers in an effort to wrap up the poll rather than think about each question. It is evident in the responses, as it appears respondents stop responding to some of the questions as the total responses drop off as you move through the poll.
If you scroll to the last page you will find the methodology section of the poll. First, you will recognize that the “Sampling Method” section states that the results were compiled from “YouGov’s opt-in Internet Panel using sample matching.” Remember, OPT-IN POLLS ARE GARBAGE. Twitter polls? Facebook polls? All garbage. This is one step above that.
Under the Number of Respondents, you will see 1500. Why on this earth would they allow a non-registered voter to participate in the first place? I’m all shoulders on that one. While it appears they remove the non-registered from some of the questions, but then include them in others. No rhyme or reason as to why.
Next, they make another huge mistake: Allowing respondents to self-identify whether or not they are registered voters. No one wants to be an irresponsible person or disengaged citizen. Asking someone if they are a registered voter is almost the same as asking someone if they hate people who kick puppies. Very few people are going to answer in the negative.
On the bottom of the methodology section, you’ll find that they say “30 questions not reported.” What were those questions? Why were they not reported? There’s no way of knowing what those questions were (presumably they were demographic questions?) and leaving unknown aspects of any data immediately leads to questions about the accuracy of the poll.
Now, as we look at the sample in the crosstabs section, on Page 20 of the poll, you will find the results of the question, “How enthusiastic are you about voting for President in the upcoming presidential election in November?” Again, if you ask a question in a way that could lead to potential shame (enthusiasm for voting at all vs. enthusiasm in voting for a particular candidate) you’re going to get skewed results. On page 21, let’s examine the 2020 vote breakdown and the Party ID breakdown.
In the 2020 Vote section it shows that Trump has a 86 to 82 advantage over Biden in any positive enthusiasm (Extremely, Very, Somewhat) section. Remember, this poll gave Biden an 11 point lead on the topline. Under Party ID, you’ll find similar results as 87% of Republicans have a positive enthusiasm (Extremely, Very, Somewhat) in voting in the Presidential Election, compared to just 70% for Dems. Further down on Page 36 and 37 you will find the question, ” Who do you think will win the 2020 Presidential Election?” Again, only 69 percent of Biden voters believe he is going to win, while 86% of Trump voters believe he is going to win.
These two questions show that Biden voters are neither as enthusiastic nor confident in their nominee as are Trump voters in theirs’.
Then how would this poll show Biden with an 11 point lead? Simple: Sampling is WAY off. Depending on a poll, you may see a poll give one party a 3-5% advantage over the other. Much above that and your sample will taint the results of the poll. In this poll, beyond the already-identified-above flaws with it, you’ll find they oversampled Democrats by nearly 10 points.
In Question #10, found on pages 24 and 25 of the results, respondents were posed, “If an election for president were going to be held now and the Democratic nominee was Joe Biden and the Republican nominee was Donald Trump, would you vote for…?”
This question was posed to just registered voters and gave Joe Biden a 51% to 40% lead in the poll. Crazy, right? Except on page 25, we can see how respondents answered and how many from each party answered. Of the 1,207 respondents to the question, 494 self-identified as Democrats and only 314 self-identified as Republicans (the remaining 399 were independent/third party). Simply put, of the respondents polled, nearly 41% self-identify as Democrats, while only 26% self-identify as Republicans. A 15 point advantage for Dems built into the data. That number isn’t included in the methodology… I wonder why??
Welp, there’s your problem. Even if they gave Democrats a 5 point advantage, that’s still an oversampling of Dems by 10 points!!! If we were to reapply these same results, but adjust them with Dems still having a 5 point advantage AND eliminating effects from enthusiasm, you’d still have a Trump lead.
BUT WAIT! There’s more!
Throughout the next couple of months leading up to election day, I will be providing polling analysis here at RedState with some short articles on the front page of the site. My more in-depth articles, like this one, will be found in the VIP Section after September 15th exclusively for subscribers. Be sure to use the code “POLLTHIS” to receive a discount!


Join the conversation as a VIP Member