

Polls are back in the news, with the release of four public polls and an internal Gabriel Gomez campaign poll in the June 25 Massachusetts special Senate election to replace John Kerry. 3 of the 4 public polls show Ed Markey with a distinct but still surmountable lead, an average of 6 points; the fourth shows him up by 17 and looks like an outlier, adding 2.7 points by itself to Markey’s lead in the RCP average. The Gomez campaign’s internal poll shows Markey by 3; if you use the general rule of thumb that a campaign conducts multiple internal polls and will only release its most favorable internal, that’s consistent with this currently being a 5-7 point race. Which is not a bad place for a Republican to be in Massachusetts five weeks before the election – it gives Gomez a puncher’s chance in a special election – although you’d clearly still put better than 50/50 odds on Markey.
The closest public poll so far was put out by progressive Democratic pollsters PPP; its first poll of the race has Markey up by 4, 44-40. Let’s take a look at how PPP polled the last Senate race in Massachusetts, the 2012 race between Scott Brown and Elizabeth Warren, which Warren ultimately won 54-46. That race may be less predictive of this one than the 2010 special election between Brown and Martha Coakley (in which PPP was one of the more reliable pollsters), but it’s interesting as an exercise in examining how PPP samples the electorate.
PPP v Rasmussen
PPP is one of two national pollsters – the other being Rasmussen – to publish regular statewide polls across the country, and that frequency in and of itself has made both pollsters into major players in public polling. At the moment, PPP is riding high, having posted a better record in 2012 than Rasmussen, while Rasmussen (who did some polling for Republicans in the past and retains a presence in conservative media) had built its reputation in better years for the GOP like 2002 and 2004. There’s a chicken-and-egg question in there, as to whether pollsters with something of a partisan tilt are just getting lucky in years when the electorate favors their side; as I noted in my November post-mortem, the stricter likely-voter screens of pollsters like Rasmussen worked better in the turnout environments of 2002 and 2004, while PPP’s looser screen better approximated turnout in 2012.
For an example of a race that Rasmussen polled much better than PPP, consider the 2010 North Carolina Senate race between Richard Burr and Elaine Marshall. PPP is based in North Carolina and closely tied to that state’s Democratic Party; I have no idea whether it was doing non-public polling for the Marshall campaign, but its polls were clearly less favorable for Burr than Rasmussen or other pollsters. PPP conducted 11 of the 30 polls taken in 2010 that were included in the RCP average. 7 of those 11 polls showed Burr polling below 45%, including two that had him below 40%; only 3 of the other 19 polls conducted by other pollsters showed Burr below 45% at any point in the race. 8 of PPP’s 11 polls had Burr with a single-digit lead; only 4 of the other 19 did. Between September 8 and October 25, the race was polled 8 times; the two PPP polls in that period showed Burr leading 49-36 and 48-40, while the other six polls all showed a lopsided race, with an average result of Burr 52, Marshall 35. PPP’s final poll suddenly got with the program (Burr 52, Marshall 40), and the race ended Burr 55, Marshall 43. You can see in this graph the PPP and Rasmussen polling of that race, which Rasmussen also polled 11 times in 2010:
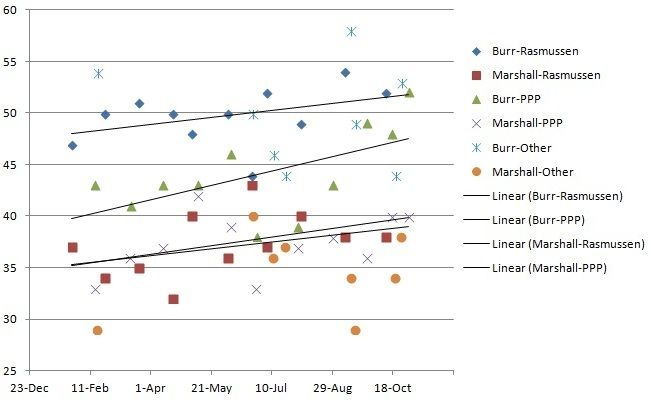
PPP’s polling single-handedly drove the coverage suggesting that Burr was vulnerable, it was out of step with the other pollsters, and it was flat-out wrong. PPP was hardly the first or last pollster to blow a race, of course; the point here is to identify an example of a race where Rasmussen’s approach was clearly a lot more reliable guide to what was happening than PPP’s. All pollsters require careful scrutiny if we are to use their work product as tools for advancing rather than obscuring our knowledge of elections, and the halo effect surrounding PPP after the 2012 election should not exempt it from that scrutiny.
As we have seen before, PPP’s methodology for polling differs from that of Rasmussen and other pollsters; in lieu of likely-voter screens, Tom Jensen (who runs PPP) has described how he models the demographic composition of his polls:
Jensen conceded that the secret to PPP’s success was what boiled down to a well informed but still not entirely empirical hunch. “We just projected that African-American, Hispanic, and young voter turnout would be as high in 2012 as it was in 2008, and we weighted our polls accordingly,” he explained. “When you look at polls that succeeded and those that failed that was the difference.” Given the methodological challenges currently confronting pollsters, those hunches are only going to prove more important. “The art part of polling, as opposed to the science part,” Jensen said, “is becoming a bigger and bigger part of the equation in having accurate polls.”
And those hunches can change over the course of a race – consider PPP’s shifting estimate of the racial makeup of the Florida electorate in 2012, as compiled by Sean Davis:
| Month | White | Non-White |
|---|---|---|
| 17-Apr | 71 | 29 |
| 5-Jun | 70 | 30 |
| 3-Jul | 69 | 31 |
| 12-Sep | 70 | 30 |
| 23-Sep | 69 | 31 |
| 14-Oct | 66 | 34 |
| 28-Oct | 64 | 36 |
| 5-Nov | 66 | 34 |
| EXIT POLL | 67 | 33 |
As you can see, PPP dramatically shifted gears based on something starting in its October 14 poll, and that enabled it to get closer to the final result as reported by exit polling. The vagueness of Jensen’s public explanations of his methodology suggest a man who is not really sharing his secret sauce. My guess – which I stress here is pure speculation in the absence of evidence, so I’m happy to be corrected by Jensen – is that PPP may have been doing non-public work for OFA or some other Democratic or liberal-interest-group client, and gathered information (maybe about OFA’s superior turnout operation, maybe about non-public polls) that was not generally available, and modeled its polling assumptions around that. (There’s nothing illegal or necessarily unethical about doing so, but if that’s the case, it would suggest that public polling is more driven by non-public information than you might think). If that’s how Jensen formed his assessments of the electorate, then we can assume that PPP’s turnout-projection models will continue to be superior so long as Jensen has access to better-informed sources of non-public information than other pollsters (it’s clear that in 2012, Democratic campaigns knew things about turnout that Republican campaigns didn’t, and Republican campaigns did not know any things about turnout that Democratic campaigns didn’t; one hopes this will not always be the case, as it plainly was not in 2004).
On the other hand, if we take Jensen at face value and assume he really is just guessing, then his guesses are as variable as those of any other reasonably well-informed pundit. The 2012 Massachusetts Senate race is just one of many case studies from which we can look at how PPP’s shifting assumptions about turnout interacted with its polling.
Brown v Warren
PPP polled the Brown-Warren Senate race in polls released on August 21, September 16, October 12, and November 2. (I’m citing here the dates the polls were publicly released; PPP generally takes polls over the prior 3 days). Here’s the topline result of those polls:
| Aug | Sept | Oct | Nov | |
|---|---|---|---|---|
| Brown | 49 | 46 | 44 | 46 |
| Warren | 44 | 48 | 50 | 52 |
PPP showed Brown with a 5-point lead in August, at a time when Brown held about a 1-point lead overall in the RCP average – but according to PPP, the race shifted 7 points in Warren’s direction in September, 4 more points in October, and 2 more into November. PPP’s final result actually understated Warren’s margin of victory by 2 points. What changed? In each case, I will compare PPP’s internals to the exit polls.
Gender
The truck-driving Brown against the archetypically schoolmarmish Warren was a race tailor-made for a gender gap, and what is perhaps most striking about PPP’s polling down the stretch run of this race is the sharp turn towards a female-dominated electorate:
| Aug | Sept | Oct | Nov | EXIT | |
|---|---|---|---|---|---|
| Female | 52 | 50 | 55 | 57 | 53 |
| Male | 48 | 50 | 45 | 43 | 47 |
| Female | |||||
| Brown | 41 | 36 | 38 | 44 | 41 |
| Warren | 50 | 56 | 58 | 55 | 59 |
| Male | |||||
| Brown | 57 | 55 | 52 | 49 | 53 |
| Warren | 36 | 39 | 41 | 48 | 47 |
The exit polls – assuming those are accurate, which is never really certain – suggest that PPP went overboard in projecting that the Massachusetts electorate would be 55-57% female in 2012, and the final poll understated the gender gap, which ended up closer to what PPP’s October poll had estimated. That said, clearly the shift to more female voters in the sample had a measurable impact on Warren’s support. For what it’s worth, the current poll showing Markey up 4 also has a 55% female sample, although the gender gap is less pronounced (Markey leads 46-36 with women, Gomez leads 45-41 with men).
Race
| Aug | Sept | Oct | Nov | EXIT | |
|---|---|---|---|---|---|
| White | 87 | 84 | 84 | 82 | 86 |
| Non-White | 13 | 16 | 16 | 18 | 14 |
| White | |||||
| Brown | 49 | 47 | 46 | 50 | 51 |
| Warren | 43 | 48 | 49 | 49 | 49 |
| Non-White | |||||
| Brown | 47 | 41 | 36 | 31 | 14 |
| Warren | 45 | 49 | 56 | 66 | 86 |
As it did in Florida, PPP started upping the non-white share of its sample in Massachusetts near the end of the race. But this time, it overshot the mark: the exit polls showed an electorate that was 14% non-white, lower than the 16-18% in PPP’s polls from September-November.
A share of the vote that small is bound to be “noisier” – that is, there’s a small-sample-size problem where it’s harder to get enough non-white voters to poll them reliably if they’re less than 20% of the people in your overall sample. While the trend in PPP’s poll was a dramatic dropoff in Brown’s non-white support, the actual numbers are just nuts: there’s no way Brown went from leading among non-white voters with 47% of the vote in August to down 35 points in November to losing by 72 on Election Day. It’s possible that there’s some instability here among whether Hispanic voters were reporting themselves as white, but that result just doesn’t make any sense at all.
Among white voters, PPP’s final poll showed Brown pulling ahead for the first time since August, even as his overall standing was at its low ebb; the exit poll showed him winning white voters 51-49 but losing the race due to his poor standing with the remaining 14% of the electorate.
PPP’s Gomez-Markey poll has an 84% white electorate with Gomez down 2 points among white voters (41-43), underperforming Brown but with a lot of undecideds, and 13 among non-white voters (36-47), a showing with non-white voters that’s consistent with Brown’s August-September polling but wildly inconsistent with the exit polls.
Age
The other big dividing line in 2012 was the youth vote. Let’s look at what PPP’s poll sample looked like by age:
| Aug | Sept | Oct | Nov | EXIT | |
|---|---|---|---|---|---|
| 18-29 | 17 | 9 | 12 | 15 | 19 |
| 30-45 | 25 | 21 | 25 | 24 | 23 |
| 46-65 | 40 | 48 | 42 | 41 | 39 |
| 65+ | 18 | 22 | 21 | 20 | 19 |
| 18-29 | |||||
| Brown | 43 | 47 | 33 | 50 | 39 |
| Warren | 47 | 50 | 52 | 48 | 61 |
The number of 18-29 year olds answering the September 13-16 poll dropped in half from August and didn’t recover until November – that could be the result of any number of anomalies, but I have to assume that it had something to do with it being the start of the college calendar (Massachusetts has an enormous proportion of college students). But even so, not one of PPP’s polls matched the 19% under-30 turnout of the exit polls (bear in mind here, however, that younger voters may be more likely to answer exit polls). The youth-voter sample is, again, noisy – Warren was bleeding Brown’s support among young voters into October, but PPP’s final poll had Brown winning 50% of the under-30 vote; the exit polls had him lose it by 12 points.
(Note one other minor methodological discrepancy: PPP’s use of an age 30-45 bracket, whereas the exit polls used a 30-44 bracket).
The Gomez-Markey poll had just 9% voters under 30, which may not be a bad estimate for a special election after the end of the college year, with Gomez down 40-33 among young voters.
Party ID
The great polling debate of 2012 was weighting of polls by party ID and the corresponding importance of independent voters. Massachusetts is a strange animal: independents are traditionally close to half the electorate, while there are more than twice as many Democrats as Republicans. Most independents in Massachusetts are not closet Republicans, as the usual strength of statewide Democrats can tell you, but many are persuadable – and given the tiny number of self-identified Republicans, a Republican candidate needs to clean up in a large way with independents to win. Brown’s support among independents never faltered in PPP’s polls or the exit polling (although if both sets of polls are treated as credible, it would suggest that Warren corralled all the late-deciding independents), but the partisan polling shows a different story:
| Aug | Sept | Oct | Nov | EXIT | |
|---|---|---|---|---|---|
| D | 38 | 38 | 41 | 39 | 39 |
| R | 15 | 17 | 16 | 16 | 17 |
| I | 48 | 45 | 43 | 45 | 45 |
| D | |||||
| Brown | 20 | 13 | 13 | 15 | 11 |
| Warren | 73 | 81 | 82 | 84 | 89 |
| R | |||||
| Brown | 91 | 94 | 90 | 88 | 95 |
| Warren | 7 | 5 | 6 | 12 | 5 |
| I | |||||
| Brown | 58 | 56 | 57 | 59 | 59 |
| Warren | 32 | 35 | 35 | 38 | 41 |
The October PPP poll oversampled Democrats and the August poll with Brown up 5 actually undersampled Republicans, but otherwise PPP’s polls were fairly consistent in their partisan sampling for this race. But what PPP was reporting was a steady consolidation of Democrats behind Warren as she made the race more ideological and put the primary behind her. On the other hand, every PPP poll, especially the final one, understated Brown’s support among his own party.
(By contrast, the self-reporting of voter ideology was about the one element that was very consistent month to month in PPP’s polling, but I’ve never really put much stock in self-reported voter ID).
The Gomez-Markey poll had a D-heavy sample at the expense of independents, 41/17/42 D/R/I, with Gomez up 47-31 among independents, Gomez drawing 21% of Democrats and Markey drawing 17% of Republicans – all signs of a race the voters haven’t really focused on yet.
Conclusion
The new conventional wisdom on polling is that the key to accurately forecasting elections is getting the demographics right: if you predict who will vote, by race, gender, and age, you can pretty accurately profile who they will vote for. Yet despite PPP’s status as one of the icons of this brave new era of polling, its record in the 2012 Brown-Warren race – a race in which its topline results ended up on the mark – suggests that it was actually better at modeling the electorate by party ID and ideology than by race, gender or age, that its assumptions about the demographics of the electorate changed a good deal from month to month, and that within each demographic group its reported results were often highly unstable.
Given the difficulty of accurately projecting turnout in special elections, even the polling averages have to be taken with some grain of salt in the best of times, but polling in the age of Obama is ever more art than science.


Join the conversation as a VIP Member